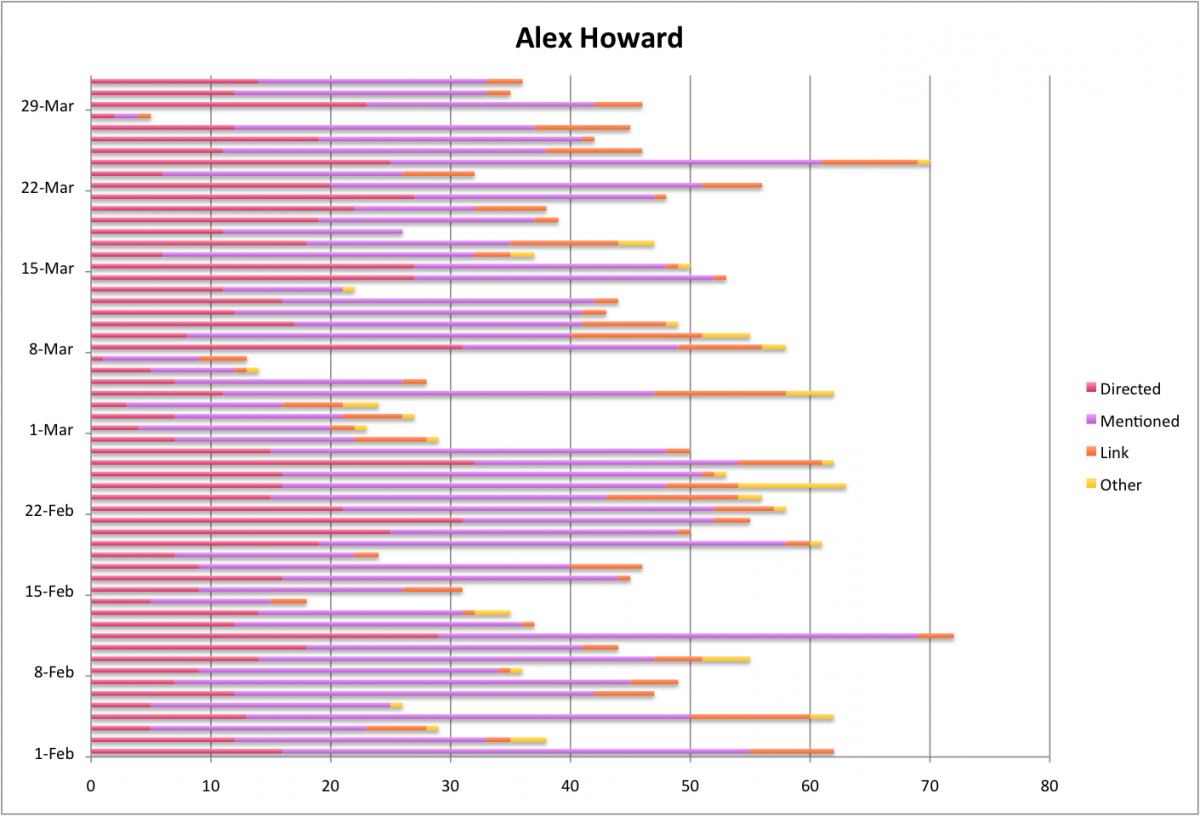
Continued on from Part 2, I’m representing similar data in a different (less exciting) way.
Before, we looked at how the activity on the twitter streams was spread out over the day and by different types of interaction. Here, I’m using charts to show the breakdown for the day, by user. I’ve also created charts for each type – these are too busy to show much more than users who are way above average in a particular tweet type.
Like last time, something is either:
- Directed
- Not directed, but containing a mention
- Contains a link, not an @ mention
- None of the above.
I’m using the existing code I’ve built up – Apache POI to import and some custom data-structures.


One reply on “Part 3: Who’s Talking About The Future Of Newspapers?”
[…] This post was mentioned on Twitter by Steve Outing, Alfred Hermida, Mark_Hamilton, Canada tourism, Alison Loat and others. Alison Loat said: Trying to sort out what this visualization means. @kirklapointe's is so yellow. @deaves @hermida @mathewi, any insight? http://bit.ly/a8o1YF […]
[WORDPRESS HASHCASH] The comment’s server IP (208.74.66.43) doesn’t match the comment’s URL host IP (74.112.128.10) and so is spam.